下載 APKPure App
可在安卓獲取iBrainEEG2的歷史版本
內在功能Conectivity網絡和腦電圖電極位置10-20
Visualization of complex neuroimaging data such as functional connectivity and his relation to EEG is a challenge. Many different visualization solutions to view complex image data have been proposed. Some authors described 2-D and 3-D neuroimaging visualization methods for tractography and functional connectivity data. Others described an anaglyph method to view neuroradiological 3-D images.
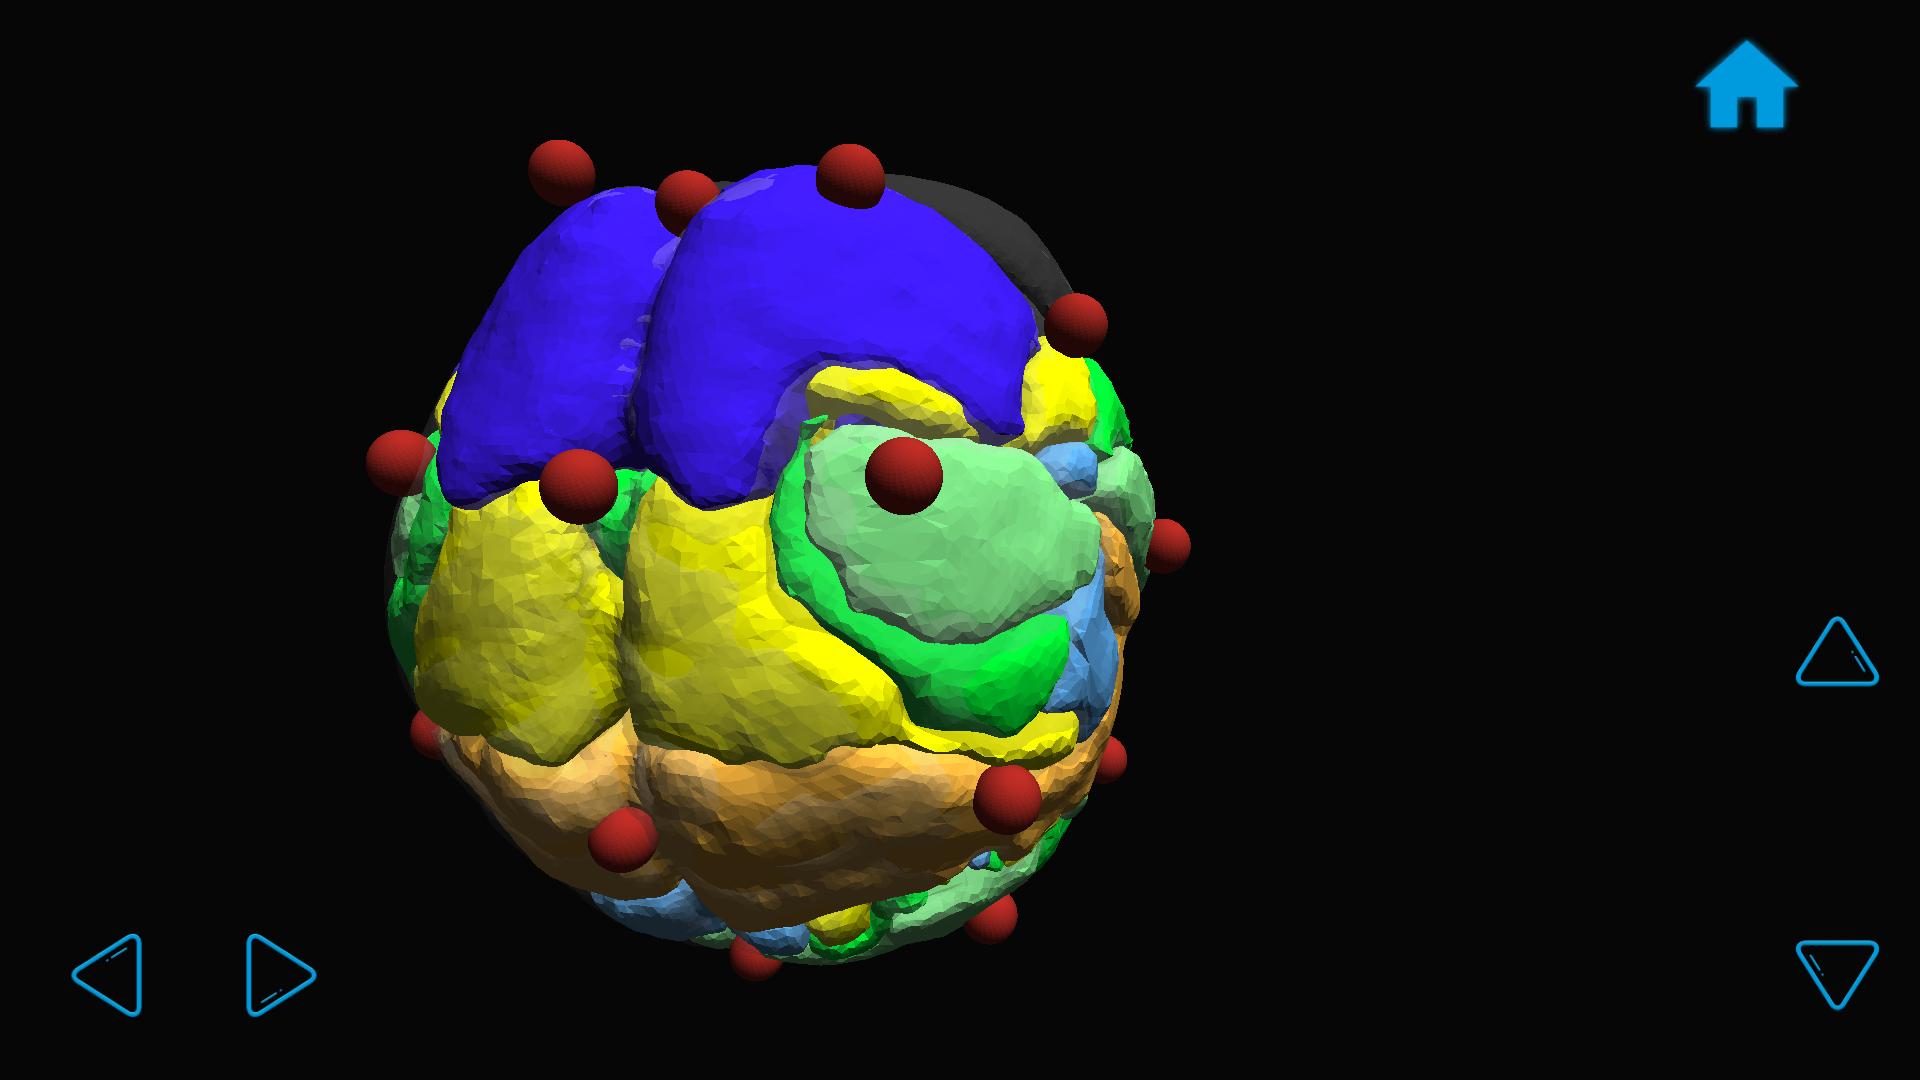
EEG is the standard diagnostic method for epilepsy, and the relation of EEG electrodes position and functional connectivity data could be of interest. Here we could download an Android app that shows the position of EEG 10-20 electrodes in relation to 7 standard functional connectivity networks.
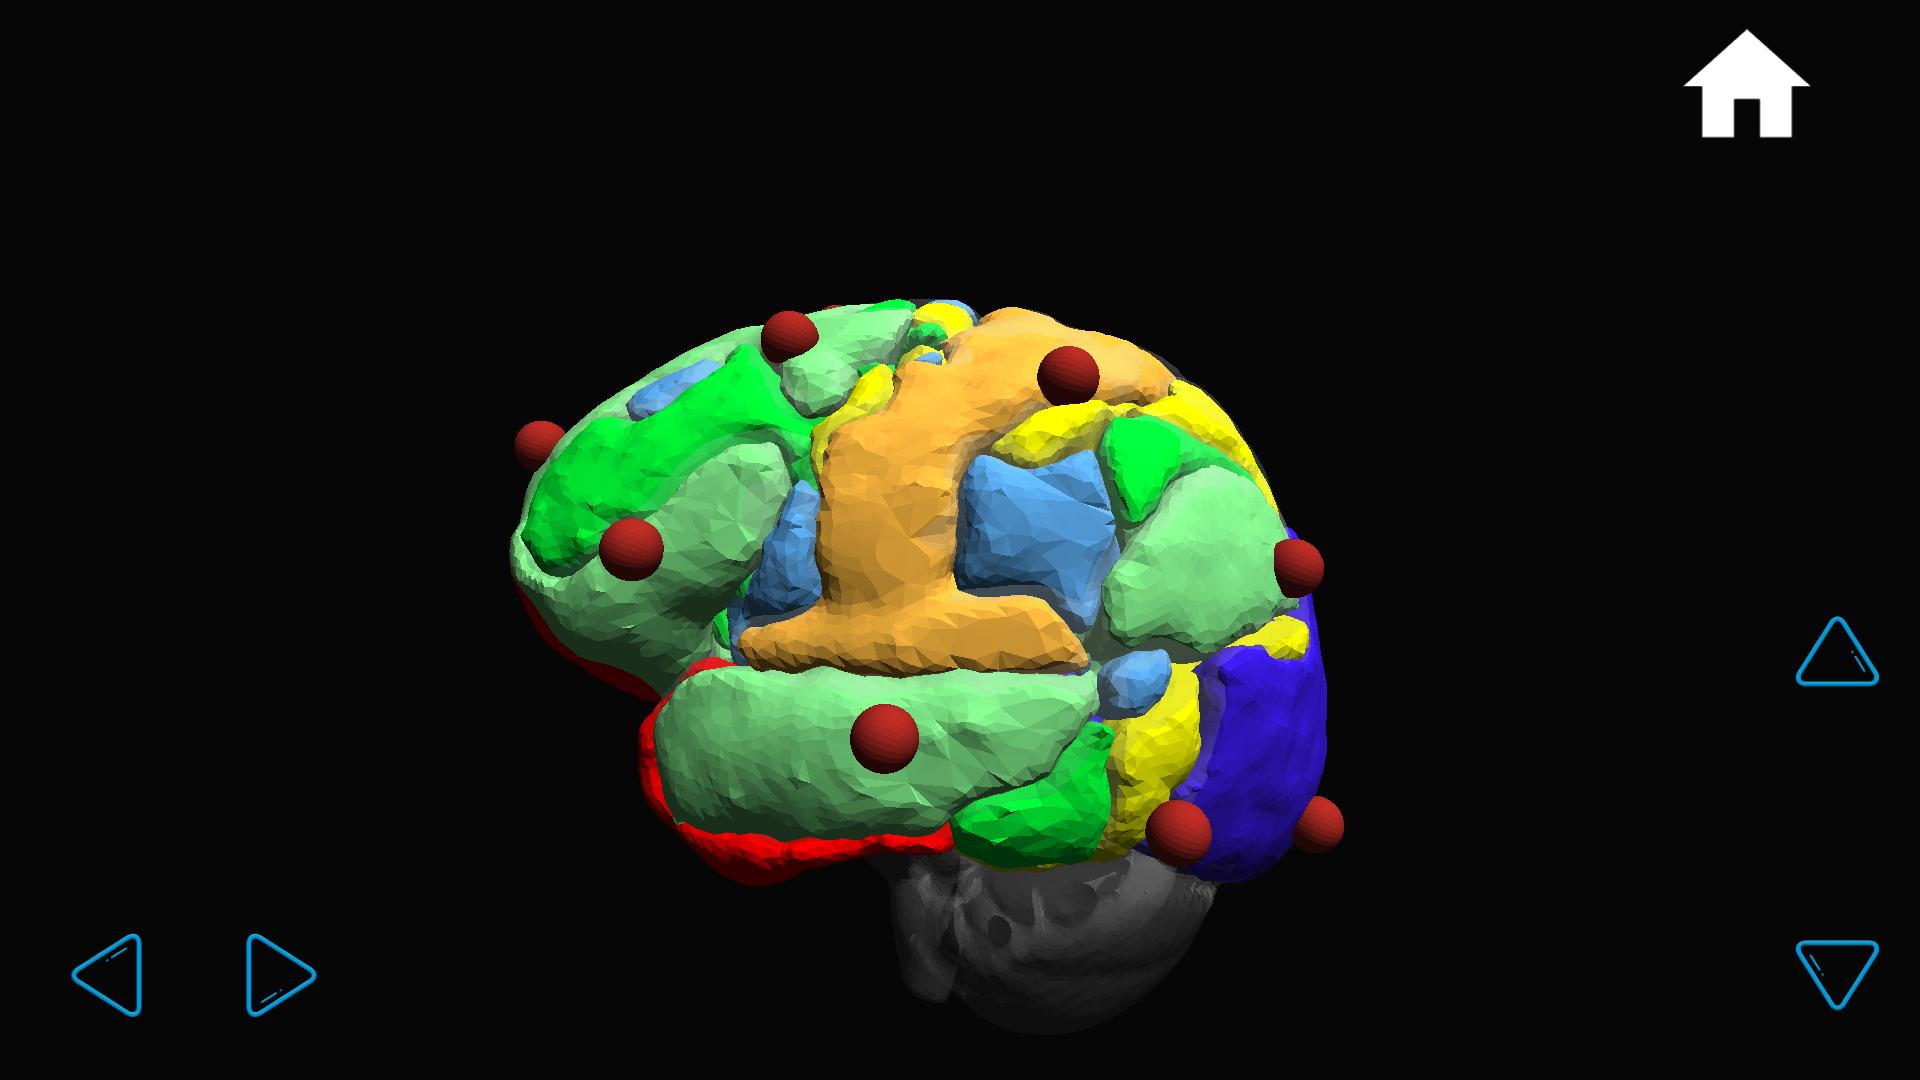
iBraiNEEG (intrinsic Brain Networks and EEG electrodes) application: The user view a 3D transparent brain with 7 standard functional connectivity networks and EEG 10-20 electrodes as red spheres over the brain. The user could rotate the brain using onscreen controls, and by tapping each electrode, the name of it appears on screen. By tapping the three points at the left side of the screen, the name of each functional network will appear.
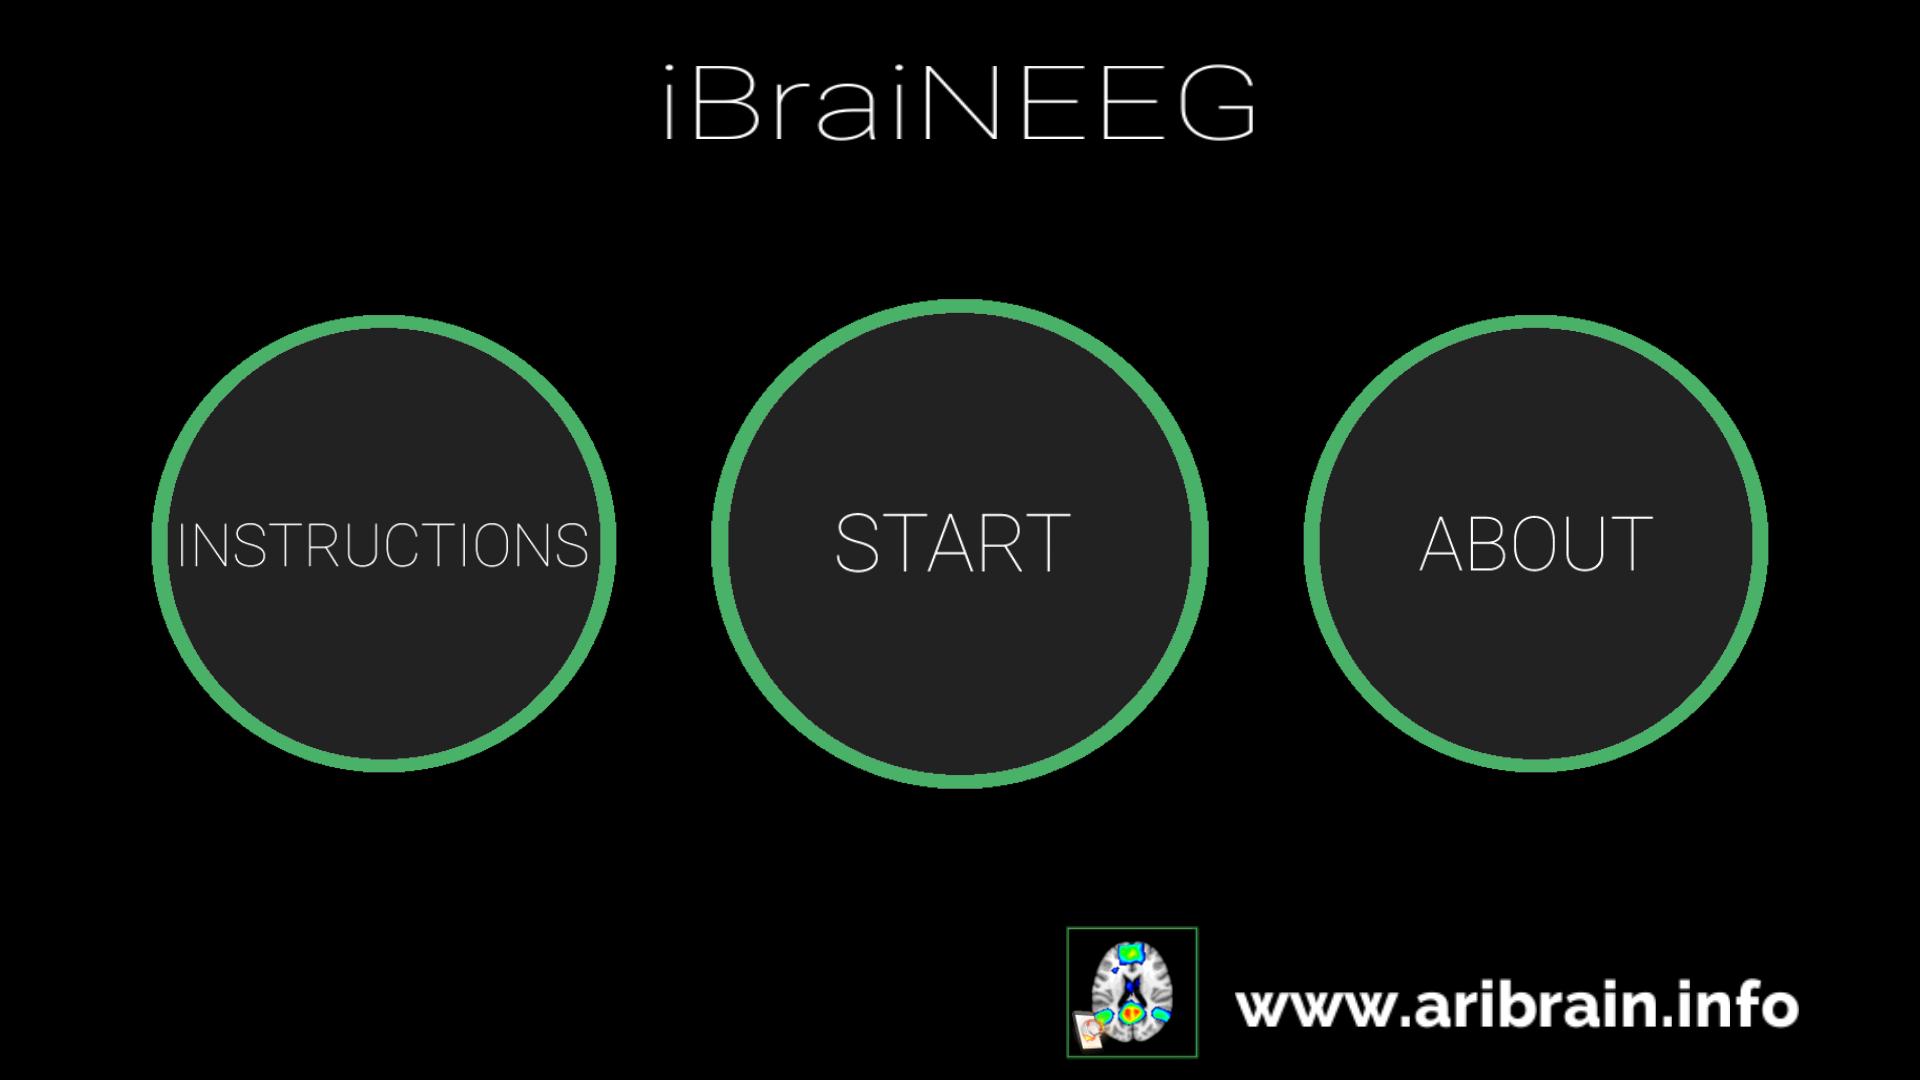
iBraiNEEG is an application tool that helps to analyze EEG data in relation to functional connectivity networks.
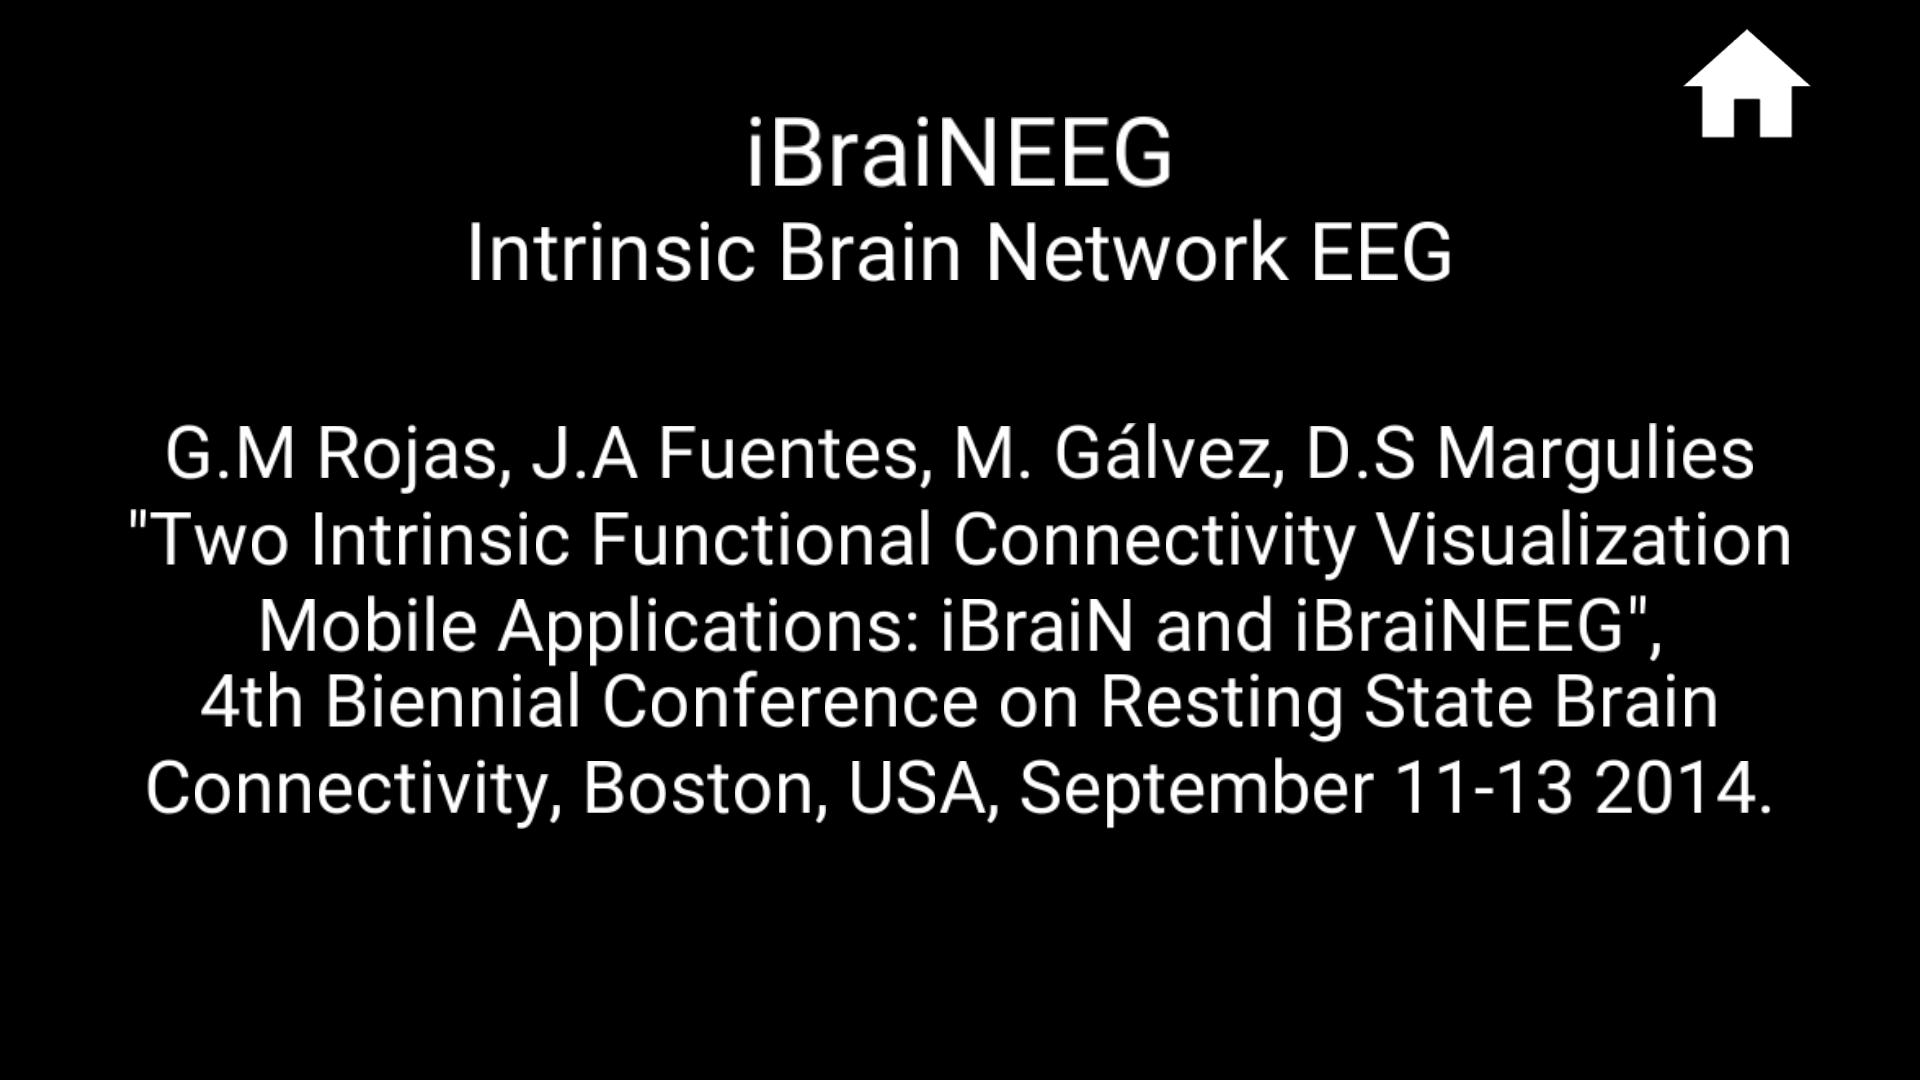
Ref: G.M Rojas, J.A. Fuentes, M. Gálvez. "Two Intrinsic Funtional Connectivity Visualization Applications: iBraiN and iBraiNEEG", 4th Biennial Conference on Resting State Brain Connectivity, Boston, USA, September 11-13 2014.
Last updated on 2016年02月05日
Minor bug fixes and improvements. Install or update to the newest version to check it out!


iBrainEEG2
1 by AriBrain Dev
2016年02月05日