Use APKPure App
Get Candlestick Patterns Charts old version APK for Android
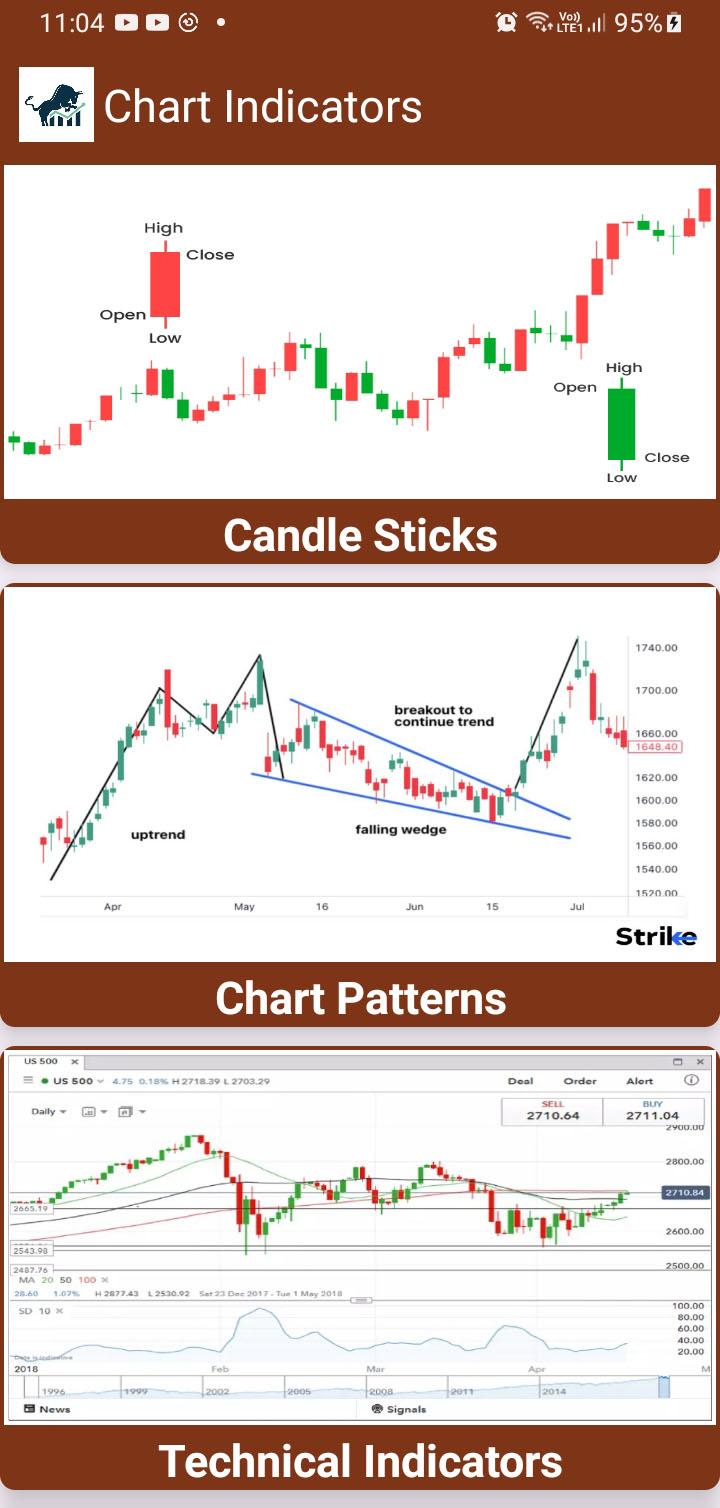
Learn Stocks Candlestick Indicators, Candlestick Charts, Candlestick Graphs
Are you trader or investor in the stock market and want to learn profitable trading?
If you want to be a profitable stock investor and stock trader or want to invest money in IPO or mutual fund, first of all, you need to understand the different types of candlestick charts, candlestick patterns and candlestick graphs used to work the stock market.
From these different types of chart patterns, you can learn about buy and sell signals as well as the best candlestick patterns for day trading. after studying different types of candlesticks patterns you will know when to buy and sell stock. and you can move towards a profitable move.
In this candlesticks pattern chart application, we put so many candlesticks and indicators diagram images and also gave information on how to study them like,
• bullish candlestick patterns
• bearish candlestick patterns
• bullish reversal patterns
• forex candlestick patterns
• bullish chart patterns
• bearish chart patterns
• japanese candlestick patterns
• cryptocurrency candlestick patterns
• nasdaq candlestick chart
• forex trading candlestick patterns
• candlestick buy and sell signals
• candlestick trend reversal patterns
• candlestick pattern for intraday trading
• best bullish candlestick pattern
• best bearish candlestick pattern
• s&p 500 candlestick
• candlestick screener
• spy stock candlestick
• candlestick pattern learning
• stock trading candlestick chart
• learn candlestick patterns for day trading
• candle patterns
• candle bar chart
• candlestick indicators
Types of Candlesticks Pattern
• Hammer and Inverted Hammer
• Pin Bar
• Engulfing
• The Morning Star
• The Evening Star
• Three White Soldiers
• Three Black Crows
• Dark Cloud Cover
• Hanging Man
• Doji
• Harami
• Marubozu
• Tweezer Top and Bottom
Types of Chart Patterns
• Head and Shoulders
• Double Top
• Double Bottom
• Rounding Bottom
• Cup and Handle
• Wedge
• Pennant of Flags
• Ascending Triangle
• Descending Triangle
• Symmetrical Triangle
Types of Technical Indicators
• Moving Average
• EMA
• MACD
• RSI
• PSAR
• ADX
• Stochastic Oscillator indicator
• Bollinger Brands Indicators
• Standard Deviation Indicator
• Fibonacci retracement Indicators
• Williams Percent Range
• CCI
• Ichimoku Cloud Indicator
• OBV
• A/D
• PPO
• AO
Types of Investment
• Stock
• Bond
• Mutual Funds
• Property
• Money Market Fund
• Retirement plans
• Insurance Policies
Last updated on Aug 7, 2024
Minor bug fixes and improvements. Install or update to the newest version to check it out!
Latest Version
![]() 10.0
10.0
Uploaded by
Andy Scott
Requires Android
Android 7.0+
Available on
![]()
Category
Report


Discover what you want easier, faster and safer.

Candlestick Patterns Charts
10.0 by Life Time Infotech
Aug 7, 2024